Introduction to Trading View: Features and Benefits
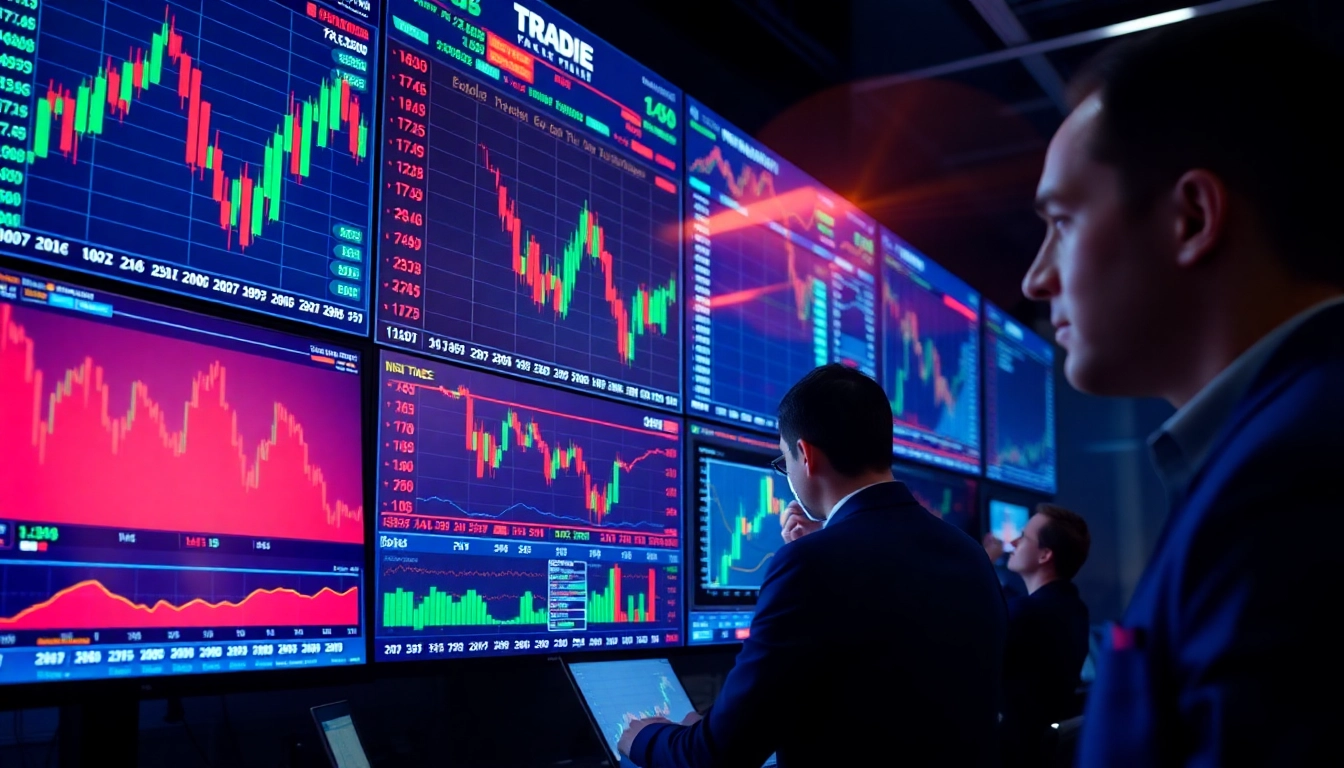
In the fast-paced world of financial markets, traders and investors continuously seek reliable tools that provide comprehensive market analysis, real-time data, and community insights. trading view has emerged as a leading platform, revolutionizing how market participants analyze, chart, and communicate about global markets. With its intuitive interface, robust features, and social trading elements, Trading View offers an all-in-one solution that caters to both novice traders and seasoned professionals. This article explores the platform’s core features, practical applications, and how it can empower you to make better trading decisions.
What is Trading View and How Does It Work?
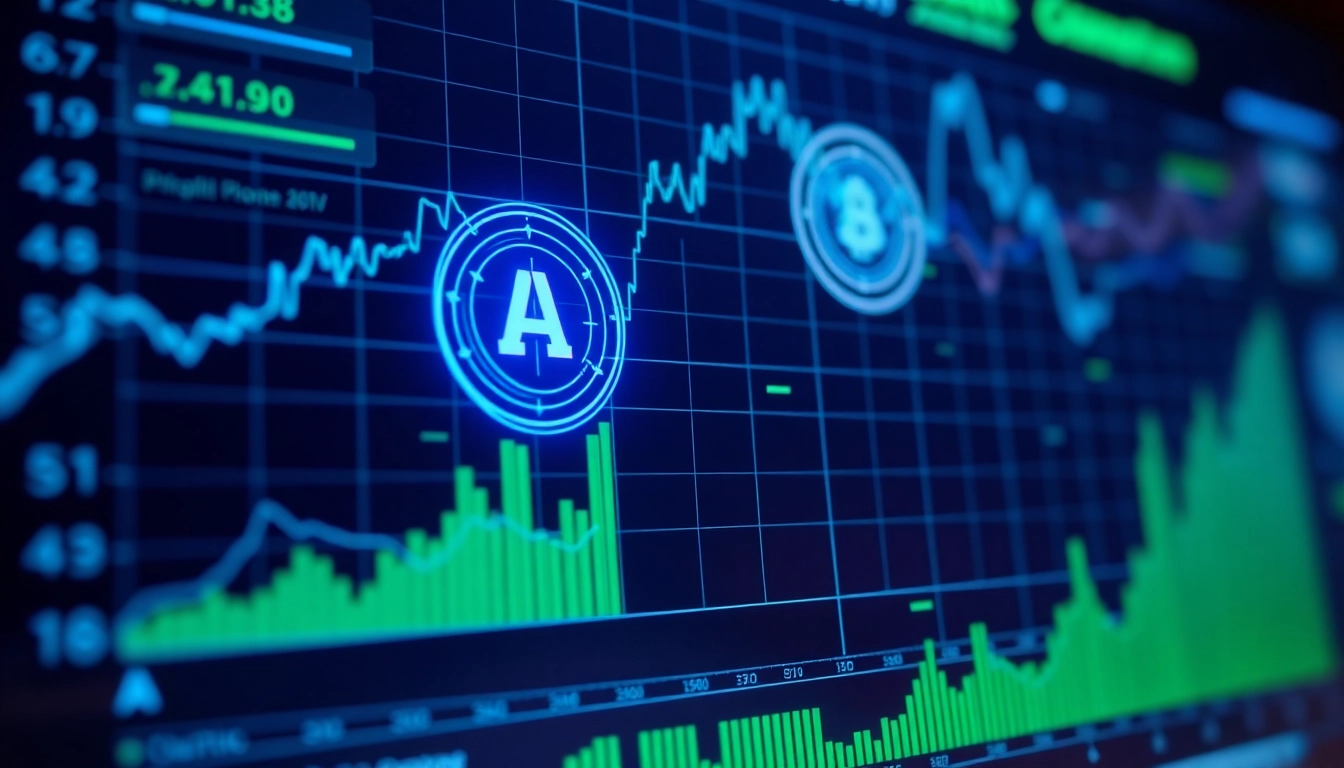
Trading View is a web-based financial analysis platform designed to facilitate market analysis, charting, and social interaction among traders worldwide. It functions as a supercharged charting tool that integrates data from multiple markets—stocks, cryptocurrencies, forex, commodities, and indices—allowing users to visualize trends with precision. Beyond chart analysis, it provides real-time alerts, scripting capabilities, and a vibrant community where traders share ideas, strategies, and insights. The platform works by aggregating data from various exchanges, then presenting it through customizable, interactive charts that traders can tailor to their needs. Its cloud-based architecture ensures accessibility across devices, including smartphones and desktops, making it indispensable in modern trading environments.
For newcomers, understanding how Trading View operates is vital. The platform employs a freemium model—offering free basic features alongside advanced paid plans. Users can log in, create personalized watchlists, set alerts, and access diverse technical indicators without upfront costs, while premium features unlock automation, advanced analytics, and broader customization options.
Key Features That Empower Traders and Investors
- Advanced Charting Tools: Trading View offers hundreds of technical indicators, drawing tools, and customizable chart types (candlestick, bar, line) that enable users to perform detailed technical analysis.
- Multiple Market Coverage: Real-time data streams from global exchanges and markets, including cryptocurrencies, indices like S&P 500, commodities, and forex pairs, allowing comprehensive market monitoring in a single interface.
- Alert System: Users can set precise alerts based on price movements, indicator signals, or drawing tools, receiving notifications via email, SMS, or platform alerts—crucial for timely trading decisions.
- Social Networking and Community Ideas: Trading View serves as both a charting platform and a social network where traders publish ideas, share strategies, and discuss market movements, fostering a collaborative environment.
- Scripting and Automation: The platform’s Pine Script language allows custom indicator development and trading automation, enabling traders to embed strategies directly into their charts.
- Mobile and Desktop Accessibility: Dedicated apps for iOS and Android alongside a robust web interface ensure traders stay connected and responsive, whether at home or on the move.
These features collectively equip traders with the tools needed for meticulous analysis, informed decision-making, and active community engagement, making Trading View a versatile platform in the digital trading ecosystem.
Understanding the Platform’s User Interface in Trading View
The user interface (UI) of Trading View is designed for clarity and flexibility. It comprises several core components:
- Chart Area: The centerpiece featuring interactive, customizable charts with multiple technical overlays and indicators. Users can adjust timeframes, switch chart types, and manipulate drawing tools intuitively.
- Toolbar: Located on the left and top, hosting drawing tools, technical indicators, and chart settings, allowing quick access for customization.
- Watchlist Panel: On the right, users can manage watchlists, monitoring selected symbols across various markets at a glance.
- Alert and Idea Tabs: Dedicated sections for setting alerts and sharing or browsing community ideas, integrated seamlessly within the platform.
- Settings and Profile Menu: Accessible from the upper right, enabling account management, subscription details, and platform customization.
The UI’s modular design fosters an efficient workflow, allowing traders to personalize their workspace according to their trading style—whether they prefer in-depth technical analyses or quick market snapshots. Learning to navigate these components effectively maximizes the platform’s benefits and enhances overall trading performance.
How to Use Trading View for Effective Market Analysis
Setting Up Custom Watchlists and Alerts
Creating tailored watchlists enables swift access to your selected assets, essential for active traders. To set up a watchlist: navigate to the Watchlist panel, add symbols by searching or importing lists, and customize the order. Alerts can be configured based on price thresholds, indicator crossovers, or pattern recognitions. For example, setting a price alert for Bitcoin (BTCUSD) ensures you are notified when it hits your target, facilitating timely action.
Analyzing Charts with Technical Indicators in Trading View
Technical analysis is fundamental to trading success. Trading View provides a vast selection of indicators—moving averages, RSI, MACD, Bollinger Bands, etc. To analyze: select the desired indicator from the toolbar, apply it to your chart, and interpret the signals. For instance, RSI levels above 70 might indicate overbought conditions, possibly signaling a reversal. Combining multiple indicators helps confirm entry and exit points, enhancing strategy robustness.
Integrating Social Trading and Community Insights
One of Trading View’s distinguishing features is its social ecosystem. Users can publish trading ideas, comment on others’ analyses, and participate in discussions. Monitoring popular or highly upvoted ideas can provide inspiration or different perspectives. Incorporating community insights, combined with your technical analysis, often yields more comprehensive decision-making, especially when considering new assets or market conditions.
Advanced Trading Strategies with Trading View
Automating Trades Using Trading View’s Scripting Tools
Trading View’s Pine Script language empowers traders to develop custom indicators and automated trading strategies. By coding signals—such as trend reversals or breakout patterns—users can implement alerts or even connect with brokers for semi-automated trading. This automation reduces manual errors and improves reaction times in volatile markets.
Combining Fundamental and Technical Data for Better Predictions
While Trading View excels in technical analysis, integrating fundamental data—company earnings, economic indicators, news sentiment—can refine predictions. Many traders use external sources or news feeds alongside Trading View charts to form a holistic view. For example, a technical breakout combined with positive earnings reports can increase confidence in a buy signal.
Backtesting and Improving Your Trading Strategies
Backtesting involves applying your trading strategy to historical data to evaluate performance. Trading View’s strategy tester allows users to simulate trades based on scripts, assess profitability, drawdown, and win rate. Adjustments to parameters can optimize strategies before live deployment, minimizing risks and maximizing returns.
Maximizing Performance and Engagement on Trading View
Optimizing Your Chart Layouts and Workspace
Custom configurations—such as multiple synchronized charts, watchlists, and indicator panels—enhance efficiency. Save layout presets for different trading scenarios (e.g., day trading vs. swing trading) to quickly adapt. Regularly updating these setups based on evolving strategies ensures technical readiness.
Utilizing Mobile and Desktop Features for On-the-Go Trading
Trading View’s mobile apps mirror desktop functionalities, allowing trading decisions anywhere. Push notifications for alerts ensure you don’t miss crucial market movements. Synchronizing your workspace across devices maintains continuity, enabling seamless transition from analysis to execution.
Building a Network Through Sharing Ideas and Insights
Active participation in the community by sharing ideas, commenting, and engaging with other traders fosters learning and reputation building. Analyzing successful shared ideas can inspire your strategies. Over time, this engagement can lead to collaborations, mentorship, and improved trading outcomes.
Future Trends and Innovations in Trading View
Emerging Tools and Features for Traders
Trading View continuously innovates, incorporating features like predictive analytics, more AI-driven indicators, and enhanced chart customization. Upcoming tools aim to simplify complex analysis, making advanced techniques accessible even to less experienced traders.
The Role of AI and Machine Learning in Market Analysis
Artificial intelligence and machine learning are transforming market analysis. Trading View is likely to integrate AI-based pattern recognition, sentiment analysis, and predictive models, enabling traders to anticipate market movements more accurately and respond proactively.
Strategies for Staying Ahead Using Trading View’s Latest Updates
Keeping up with platform updates, participating in beta testing, and engaging with community developments are crucial. Regularly exploring new features and incorporating them into your workflow can provide a competitive edge, ensuring your trading approach evolves alongside technological advancements.